
Showing posts with label FBMKLCI. Show all posts
Showing posts with label FBMKLCI. Show all posts
Friday, 2 January 2015
2014 KLCI closing ! A drop of 5.6% for the year
Since 2009, KLCI has been climbing every year. After 5 years, this is the 1st year KLCI drop and is a significant one of 5.6% (105 pt). Is 10+am now, KLCI has been dropping for 16pt, will this be a signal or indication, this year would not be a good year for KLCI also ? If KLCI not able to climb till upper trendline, then the downtrend momentum would consider intensified. Time will tell. This is the time for the hard core value investor to braise for the difficult time where their paper profit may have half off or for the just bought in the end of 2014, then is a huge loss that would test their patience to to hold on and to average down when the time is right .

Friday, 28 November 2014
Is this the time to buy?
KLCI still in the downtrend if you ask me. So, is a NO. But for those VERY short term trader, or I say contra players or day trader is still business as usual. For me as a Value investor cum trend trader, is a hands off period and go for holiday. Hmm....maybe I can use this opportunities to sharper my skill as a shorter term trader, but definitely this will come with a price of RISK!.
Last few weeks, I bought SKPetro as quite a few of my "kakis" was mentioning here says her a Index stock and very cheap now. Well, I know that she is in downtrend mode and is not time to go for long term investing , I just go in have a counter trend trade. I went in at 3.16, but she broke my stop loss point of 3.14, thus , I sold her 3.13, in deed she drop further, lowest at 3.04, but after that she rebound back to 3.24. I have no regret, thats what a short term trade is , obey your stop loss. And for those who think is think for investing, she is now drop to 2.82. Wow ! imagine, if I do not obey my stop loss and maybe i hesitate to sell at 3.24, then I'm in a dilemma of trapping at a loss of 10%. Well, if one is to trade and not investing, then the cut loss should be less than 10% as a guide.
Last few days, I was expecting our CI can break the last High around 1858, then we will be on track back to the good old uptrends. See below the chart, our CI has been constraint by the 2 trendlines. Well, for a short term trade, say 2~10 days trade, a good entry point when she rebound around 1806 but the safer point would be 1771 or 1700?. Lets, hope our market would be at 1700, if yes, then the 5 years once big correction or people call it market collapse is formed.

As usual, just remember my disclaimer at the left hand side.
Thursday, 4 April 2013
Finally the announcement of GE13
On 02Apr2013, there is already rumours spreading that PM will dissolve the Parliament on 3Apr2013, but then again, the CI was bullish climbing for 17pt. Finally, the announce came 3Apr, the CI was dropping furiously for -50 pt, in just a short time, the CI fight back to close somewhere -17 (not quite remember) at lunch time, and end closing +0.4 pt. Those who play future had bet on the parliament will dissolve on March , end up getting their hand burnt when they short the Mar contract. Now I see that even the announcement is on Mar, the shortist still get burnt as you can see today. Maybe those intra-day futures player will gain some and he had to be very experience and fast in his decision to take profit.
Check with one of my broker, she say foreign fund has been accummulating, that the reason our CI was bullish, even on 3Apr, our local funds is the one who is trying to push down the index but end up have to buy back after realising the foreign guys are still picking what they throw.
Hmmm, now one may wonder will the actual polling day, the index will have a big drop ? I really quite bad at guessing, so I will let the time to tell me.

Tuesday, 12 March 2013
Still Election Fear ?
When the index started to drop around 11/Jan and drop for 5 weeks, she really scared many retails or even fund managers again. Then again, fund manager can't keep waiting for the announcement, thus seeing some indicator or delaying in election announcement, some more daring retailers and fund managers come back and slowly and cautiously push up the market.

Well, its been 3 consecutive weeks of white candle, one may wonder, I miss the recent small rally, should I just in to catch the last bit of juice. Hmmm....I don't intend to take this risk as the risk reward ratio is big too take. So, I would maintain my patience and window shopping till the election date.
PATIENCE ! PATIENCE ! PATIENCE !......
Saturday, 26 January 2013
A breathtaking week in KLCI !
Is been a while we see a drop of >30 pt in our index in 1 day or 2 day . Those last one happened in 5/Sept where she drop 34 pts in 2 days while on 21/Jan/2013 drop 40pt in just a day. This is due to announcement of the GE announcement date to be 22/Feb ? So, expect a bigger drop on 22/Feb or the day it is announced where whatever short term or mid term TA or FA will fail. I would say that FEAR of whatever results of the outcoming election make every investor or trader not to hold too many shares in their portfolio. Hmm, so I'm also in my planning stage to trim down some long term investment stocks and buy back after the election.
I'm expecting the index will go sideway or the most climb towards 20MA and slide down further. You can see the weekly Stochastic and MACD line has bearish crossover which I do not expect to break any resistance in these 2 weeks. Initially, I intend to hold Paramon till 1.77 but seeing such jitters can happened in such a fast pace, I decided to take profit at 1.57. In this few weeks till election, I will intend to go for a very short term play (less than 1 week) if there is some stocks which I really like her chart .


I'm expecting the index will go sideway or the most climb towards 20MA and slide down further. You can see the weekly Stochastic and MACD line has bearish crossover which I do not expect to break any resistance in these 2 weeks. Initially, I intend to hold Paramon till 1.77 but seeing such jitters can happened in such a fast pace, I decided to take profit at 1.57. In this few weeks till election, I will intend to go for a very short term play (less than 1 week) if there is some stocks which I really like her chart .


Friday, 21 September 2012
My first 100th post
I have took more than 1 year to reach my 100th post, well as per my plan I target to write around 2 post per week, which means I should reach my 100th post in less than 1 year. Basically, I'm out by a month. I do want to write sometimes but time really does not allow. Example, last Friday I have entered KLCCP at 5.50 and exited yesterday due to the drastic dropped in CI about 20pt. Actually I wanted to post on Friday just after I took the trade but I'm busy preparing and celebrating my beloved wife birthday, thus I decided to give the post a miss.
This week, I also realised that our KLCI is going for a downtrend as the Lower High has formed. There also somewhat a Head & Shoulder pattern has formed. So, going for MP strategy, the risk has again double up. So, the support 1591~1593 is a key support (the neck line) to monitor closely, if breaks, then all hell broke lose, and we will have to shut all position and comeback around 1553 which is another 40pt. Come to think of today close at 1623, then this will be a -70 pt (-4%) which will at least wipe out 10~20% of most medium to small size counters. So, we really must be more careful and tighten our selection if we really into MP strategy.

This week, I also realised that our KLCI is going for a downtrend as the Lower High has formed. There also somewhat a Head & Shoulder pattern has formed. So, going for MP strategy, the risk has again double up. So, the support 1591~1593 is a key support (the neck line) to monitor closely, if breaks, then all hell broke lose, and we will have to shut all position and comeback around 1553 which is another 40pt. Come to think of today close at 1623, then this will be a -70 pt (-4%) which will at least wipe out 10~20% of most medium to small size counters. So, we really must be more careful and tighten our selection if we really into MP strategy.

Sunday, 9 September 2012
Last week is really breathtaking !
A bad week for trading really is . Drop consecutively for 5 straight days for Small Caps and and only able to breathe for a day due to Dow overnight big rise (244pt). Well, from the chart, a bullish harami was formed on Friday, will our stocks rebound, I need to see how Monday close. If there is a rebound, it would be good till 20MA at least . For trading, the risk has increased. So, lets see are we in confirming a downtrend for FBMSCAP or is there the birth of an uptrend. In a matter of a week or 2 will tell. For me, I did not hold any MP stocks (for trading), I only holding investment stocks (which I would be holding on them for at least 3~12 months). I'm still on a look out should I trade in such a hostile environment or uncertain time.


Thursday, 14 June 2012
FBMKLCI trend: Sideway or Downward ?
Our CI is at the edge of the "Megaphone" channel. Looking at the Stochastic, she has a high possibility to move downwards if the 100MA not able to sustain. Let see how she goes on tomorrow. If she breaks back into the channel, then we must get ready for the rough ride downwards....


Thursday, 26 April 2012
SELL IN MAY AND GO AWAY !
May is very near....Remember the old saying in trading ...."Sell in May & Go Away".
Why is this so???.... Hmmm, maybe because of the School holiday ??? Where the Fund Managers
will sell their holdings and go for vacation with their family ??? Or maybe in this 2012 will be a up year
for month of May ?
Lets check the history data, actually I would like to take a look only at the FBMSCAP rather that FBMKLCI cause in FBMSCAP consist of more stocks which most of us will buy into it. But my data only have 3 years of this and the result is 2 down/ 1 up, so is 67% probability (anyway I think the data would be too little to show). See below

Let see FBMKLCI , is 9 down/8 up which is only 53% . So, the saying of Sell in May & go away is not so valid for our Malaysia market. So, lets see how this 2012 May will display a Red Candle or a White Candle. My pick is a Red one. Time will tell :)

Monday, 27 February 2012
How's the overall market sentiment on 27/Feb/12 ?
Well, lets have a look at FBMSCAP, this index will tell you the overall market as most of us are buying small cap rather than those top 100 shares (FBMT100 which inclusive of the 30 index link big cap).
Well, overall the market is still healthy and she is still in the consolidation phase which I think in TA terms is not yet a buy call. But for those really into FA, is the 1st shopping stage. I would put some money into my favourite stocks for MP when the Fbmscap really show some rebound.

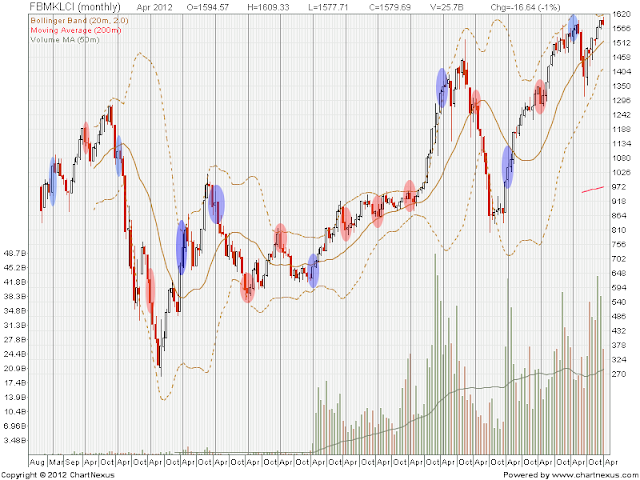
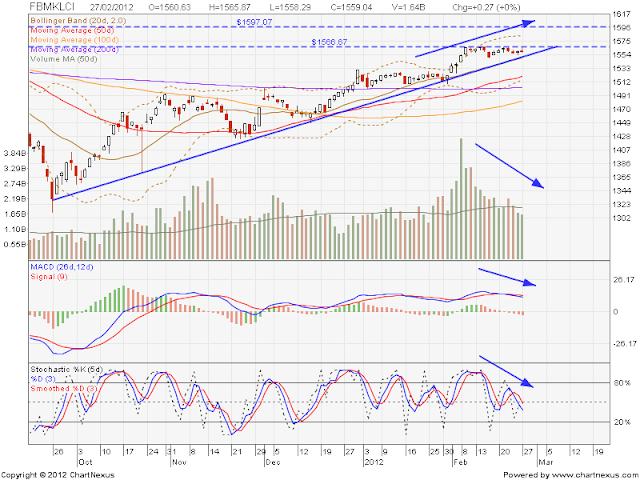
For our main index FBMKLCI, she is still uptrend & bullish but blocked at a resistance 1566. If one look at the chart closely, the bullish momentum is diminishing but again see our big boy want to push her further or not. 1600 ,any guess ? If there is a breakout above 1566 but the volume still at low, then there will only a safe bet on big cap stocks & I believe Fbmscap will continue her sideway or downtrend. So, picking big cap would have a higher probability, then again now is still too early to dictate anything as the volume will tell me where our overall market sentiment will go.
Well, overall the market is still healthy and she is still in the consolidation phase which I think in TA terms is not yet a buy call. But for those really into FA, is the 1st shopping stage. I would put some money into my favourite stocks for MP when the Fbmscap really show some rebound.

For our main index FBMKLCI, she is still uptrend & bullish but blocked at a resistance 1566. If one look at the chart closely, the bullish momentum is diminishing but again see our big boy want to push her further or not. 1600 ,any guess ? If there is a breakout above 1566 but the volume still at low, then there will only a safe bet on big cap stocks & I believe Fbmscap will continue her sideway or downtrend. So, picking big cap would have a higher probability, then again now is still too early to dictate anything as the volume will tell me where our overall market sentiment will go.

Monday, 17 October 2011
FBMKLCI short term going uptrend ?
Fbmklci have really a good rally these 4 weeks, and she has run up about 123 points, indeed if anyone pick some stocks around 1388, sure one will gain especially those bought in the FBMT100 stocks. As now she is approaching the 1474 point, it is getting interesting as these is a previous strong support (see those magenta shadings), then broke and turn into a strong resistance. So, my take is she will have a hard time passing thru this area but if she can take out this resistance in a go, then , it will be very bullish which I dont think so. Well, lets expect some retracement for our CI, and see whether 1423 and 1400 can support and form a higher low. If yes, then this support area would be good to go long again. If not, there expect another sell down. Lets see how it goes. Time will tell.


Tuesday, 27 September 2011
At what stage are we ?
As predicted yesterday, FBMKLCI market do stage a rebound following the strong guide from DAX & Dow , I would say a good rebound one indeed. And if history repeats, this CI rebound would be gaining around 60% of the recent loss. Lets see how it goes, one more last chance to clear all position, or really those G20 leaders or those European , American politician really come out with something good can last us some good rally.
Below is a good graphical representation of the market emotions, where are we ? I think we are still very high up at the stage of "Anxiety".

Below is a good graphical representation of the market emotions, where are we ? I think we are still very high up at the stage of "Anxiety".

Monday, 26 September 2011
FBMKLCI crash crash crash
That day , I was mentioning whether the big boys will let our CI crash toward 16% (1348) from the peak, they only takes 2 weeks to decide and let us go southward at super speed.... WOW ! nowadays intraday > 50pts negative is quite common, we see it now and then. And today, she crash below the 78.6% Fibonacci support (1319) before decided to retrace upward back and stay above this support, closing at 1331.8. . Hmmm.. given today DAX at 3%++ at the time I'm writing and if Dow close positive, there will be a good rebound for us, again is not to buy stocks but maybe to clear some of the losing long position. Well, those who interested in long the FKLI, may able to give you some quick bucks (to me, I will not long futures , too risky and you will not able to get a good sleep at night worrying Dow will have a big crash or not while you are sleeping.
My post on 13/Sept.
http://reiccs.blogspot.com/search?updated-max=2011-09-23T23%3A45%3A00%2B08%3A00&max-results=8
Today chart .

Pure Fundamentalist may say CHEAP CHEAP CHEAP & BUY BUY BUY to average down, well, lets see how one think, if we are to buy now and setting a target to complete all the buying, my questions is what IF after finish up ALL your fund to buy a particular good stock but she is still dropping for another 30% , then how, see other people can buy lower than you by 30%, the feeling not good , right ? Ha, then, by using some TA to help you judge the SELECTED Good Fundamental stocks, when we can start accumulating would be better, I would say at least the WAITING would be much shorter. Hmmm, I will be on a look up for this. Again, I still use some of my money to do dollar cost average for the GOOD stocks that give HIGH dividend like those REITS.
Friday, 23 September 2011
Simple analysis of Bull & Bear months
Bulls and Bears KLCI
|
|||||||||
High
|
Date
|
Low
|
Date
|
Chg
|
Chg %
|
Duration (months)
| |||
Bears
|
1
|
540.33
|
30/8/81
|
220.74
|
12/8/82
|
(319.59)
|
-59.1%
|
11
|
|
2
|
426.79
|
8/2/84
|
169.83
|
2/5/86
|
(256.96)
|
-60.2%
|
15
|
||
3
|
470.16
|
10/8/87
|
223.12
|
7/12/87
|
(247.04)
|
-52.5%
|
4
|
||
4
|
632.22
|
1/8/90
|
459.08
|
28/9/90
|
(173.14)
|
-27.4%
|
2
|
||
5
|
635.02
|
29/5/91
|
505.47
|
19/8/91
|
(129.55)
|
-20.4%
|
2.5
|
||
6
|
1,314.46
|
5/1/94
|
840.87
|
24/1/95
|
(473.59)
|
-36.0%
|
13
|
||
7
|
1,085.04
|
5/6/95
|
883.96
|
14/11/95
|
(201.08)
|
-18.5%
|
6
|
||
8
|
1,271.57
|
25/2/97
|
262.70
|
1/9/98
|
(1,008.87)
|
-79.3%
|
18
|
||
9
|
1,013.27
|
18/2/00
|
553.34
|
9/4/01
|
(459.93)
|
-45.4%
|
13.5
|
||
10
|
808.07
|
23/4/02
|
616.46
|
3/12/02
|
(191.61)
|
-23.7%
|
7
|
||
11
|
1,516.22
|
11/1/08
|
829.41
|
29/10/2008
|
(686.81)
|
-45.3%
|
10
|
||
Simple Avg
|
(377.11)
|
-42.5%
|
9.3
|
||||||
Avg (ex-1990)
|
10
|
||||||||
Low
|
Date
|
High
|
Date
|
Chg
|
Chg %
|
Duration (months)
| |||
Bulls
|
1
|
220.74
|
12/8/82
|
426.79
|
8/2/84
|
206.05
|
93.3%
|
18
|
|
2
|
169.83
|
2/5/86
|
470.16
|
10/8/87
|
300.33
|
176.8%
|
15
|
||
3
|
223.12
|
7/12/87
|
632.22
|
1/8/90
|
409.10
|
183.4%
|
32
|
||
4
|
459.08
|
28/9/90
|
635.02
|
29/5/91
|
175.94
|
38.3%
|
8
|
||
5
|
505.47
|
19/8/91
|
1,314.46
|
5/1/94
|
808.99
|
160.0%
|
28
|
||
6
|
840.87
|
24/1/95
|
1,085.04
|
5/6/95
|
244.17
|
29.0%
|
5
|
||
7
|
883.96
|
14/11/95
|
1,271.57
|
25/2/97
|
387.61
|
43.8%
|
16
|
||
8
|
262.70
|
1/9/98
|
1,013.27
|
18/2/00
|
750.57
|
285.7%
|
17
|
||
9
|
553.34
|
9/4/01
|
808.07
|
23/4/02
|
254.73
|
46.0%
|
13
|
||
10
|
616.46
|
3/12/02
|
1,516.22
|
11/1/08
|
899.76
|
146.0%
|
61
|
||
11
|
829.41
|
29/10/08
|
1,594.74
|
8/7/11
|
765.33
|
92.3%
|
32
|
||
simple avg
|
443.73
|
120.3%
|
22.3
|
||||||
Avg (ex 95 and 02)
|
19.9
|
||||||||
Current Scenario
|
|||||||||
High
|
Date
|
Current
|
Date
|
Chg
|
Chg %
|
Duration
|
|||
1594.74
|
8/7/11
|
1,387.81
|
22/9/2011
|
-206.93
|
-13.0%
|
2
|
|||
As
can be seen, our Bear market lasts an average of 10 months with an
average decline of 43% with the previous 2008 decline falling 45% from
peak to trough. Assuming a similar decline this time round, CI is
potentially looking at 920 points. Before one falls off the chair, let
me remind that this is a very simplistic way of looking at the downside.
Other factors that need to be accounted for include economic conditions
and more importantly, the intensity of the fall. We are in fact “happy”
to note that the recent sell down is significant which could help the
bearish condition end sooner rather than later.
Above Information from ECMLibra.
REI : The above is an interesting data, my take will be 2 scenerio
Scenerio 1: Taking an average data of 10 months of bear, then there will be another 8 months of bear to go before we see any bottoms till May2012.
Scenerio 2: Then again, if the rate is 13% for 2 months and KLCI is to decline say 42.5%, there will be rough another 5 months to go, by then will be around Mar2012.
So, either one, no long term play (except dollar cost averaging strategy) but we can still punt for sharp drop rebounds . Haha, this is for those itch finger type and punting is punting , it will not lead to financial freedom, so only can play small small, like the saying goes, drink a mug of beer everyday is good for you health but if more than that will be quite bad for your health.
Subscribe to:
Posts (Atom)